

Imagine plotting the series of prime numbers on a polar plot, with both the radius value and the angle value (in radians) of each point being a prime number from this series - what would that graph look like? Bizarrely, a very pretty spiral!
So, do prime number follow a pattern after all, then? The answer is below. In the meantime, here's how you can create a spiral graph and play around with it.
First, let's generate some prime numbers. We need lots of points on the graph to see the effect on the graph.

And we need to store them in a file so that we can play around with it.
Generating a prime number sequence
From the many ways in which such a sequence can be generated, using OpenSSL is the most straight forward. The OpenSSL utility can tell you if a number is prime or not, e.g.
$ openssl prime 22 (2) is prime$ openssl prime 33 (3) is prime$ openssl prime 44 (4) is not prime...$ openssl prime 999 3E7 (999) is not prime
By checking the prime-ness of every value between 2 and 10,000 (because we already know that 1 is not a prime number), and only selecting the results that state "is prime", we can generate that sequence. You can see that OpenSSL returns the result in both hexadecimal (a.k.a. "radix 16" or "base 16") and in decimal ("radix 10") in parenthesis. We only want this second value, moreover, we want it printed twice with a comma between them, to represent the radius column and the angle column for our plot. Everything is output to a file. All of this can be done in a single one-liner:
$ for i in {2..10000}; do openssl prime $i | awk '/is prime/ {print $2 "," $2}' | sed 's/[)(]//g' ; done > primes
(This runs about half a minute on my laptop and produces 1229 prime numbers up to 10,000.)
So, how does this one-liner work?
The for-loop prints all values from 2 to 10,000, which the openssl command checks for prime-ness. The result of this check is piped to the awk command, that filters only values that are prime (i.e. it filter for the string that contains "is prime" in the check result), and prints that second value from the result ($2 in awk-speak) twice, delimited by a comma, so that we get a 2-column file. The sed command removes the parenthesis, and the output is redirected into the file "primes".
Checking the first few lines of the file "primes" shows the familiar low-value prime numbers that we know and love:
$ head primes2,23,35,57,711,1113,1317,1719,1923,2329,29
So all OK, then.
Let's plot some data!
Gnuplot is one of many open-source plotting tools available and is arguably the Swiss army-knife for generating of sorts of all graphs and plots. Here we use it to plot a polar graph. And yes, this can also be done in a single statement! 😀
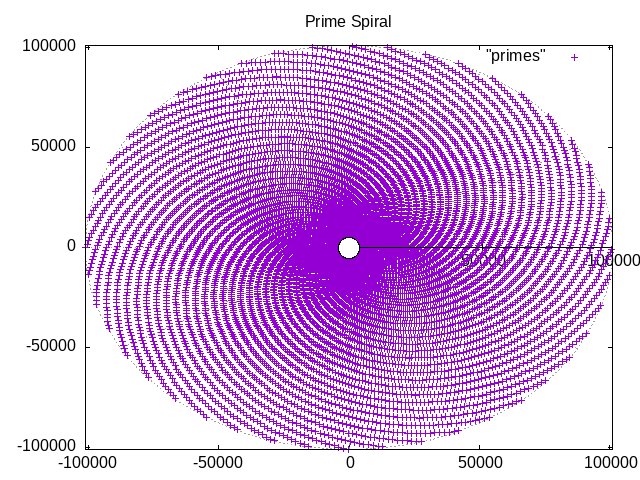
$ gnuplot <<!set angle radiansset grid polarset polarset rrange [-1000:10000]set title "Prime Spiral"plot "primes"!
Gnuplot produces this:
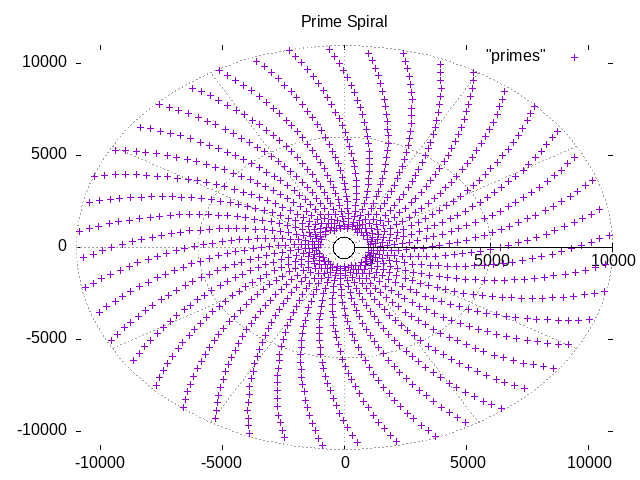
Gnuplot can also be used in an interactive mode, to allow you to explore various ways to visualize collections of data. If you want to do this in an interactive mode, open a Gnuplot terminal session, and enter following commands to get the same results:
$ gnuplotG N U P L O TVersion 6.0 etc...gnuplot> set angle radiansgnuplot> set grid polargnuplot> set polargnuplot> set rrange [-1000:10000]gnuplot> set title "Prime Spiral"gnuplot> plot "primes"
...and a plot should pop up on your screen.
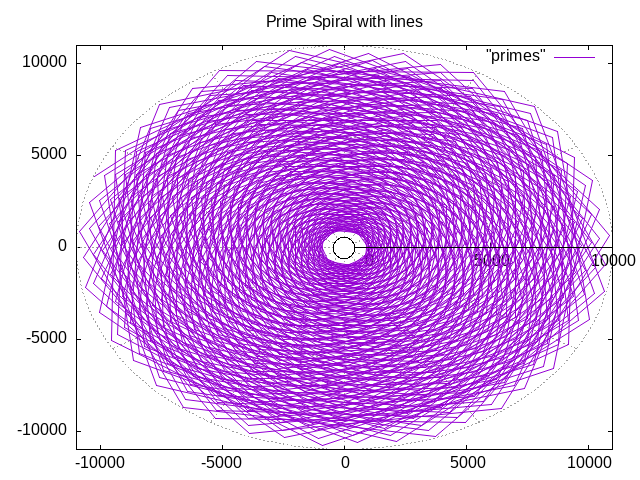
Change the last line to:
gnuplot> plot "primes" with lines
...and a plot resembling a chrysanthemum flower pops up. I'm not sure what this means, but it's pretty:
For more details, the user manual for Gnuplot can be found here: http://www.gnuplot.info/docs_6.1/Gnuplot_6.pdf.
Here is an excellent explanation of why we get this pattern, and an answer to the age-old question: Do prime numbers follow a pattern? https://youtu.be/EK32jo7i5LQ?si=Wn_5WO0QjCeJvW01